

Waitlist analytics that power business decisions
WaitQ analytics surface insights and patterns from your waitlist data, empowering data-driven decisions. All without manual calculations or spreadsheets.
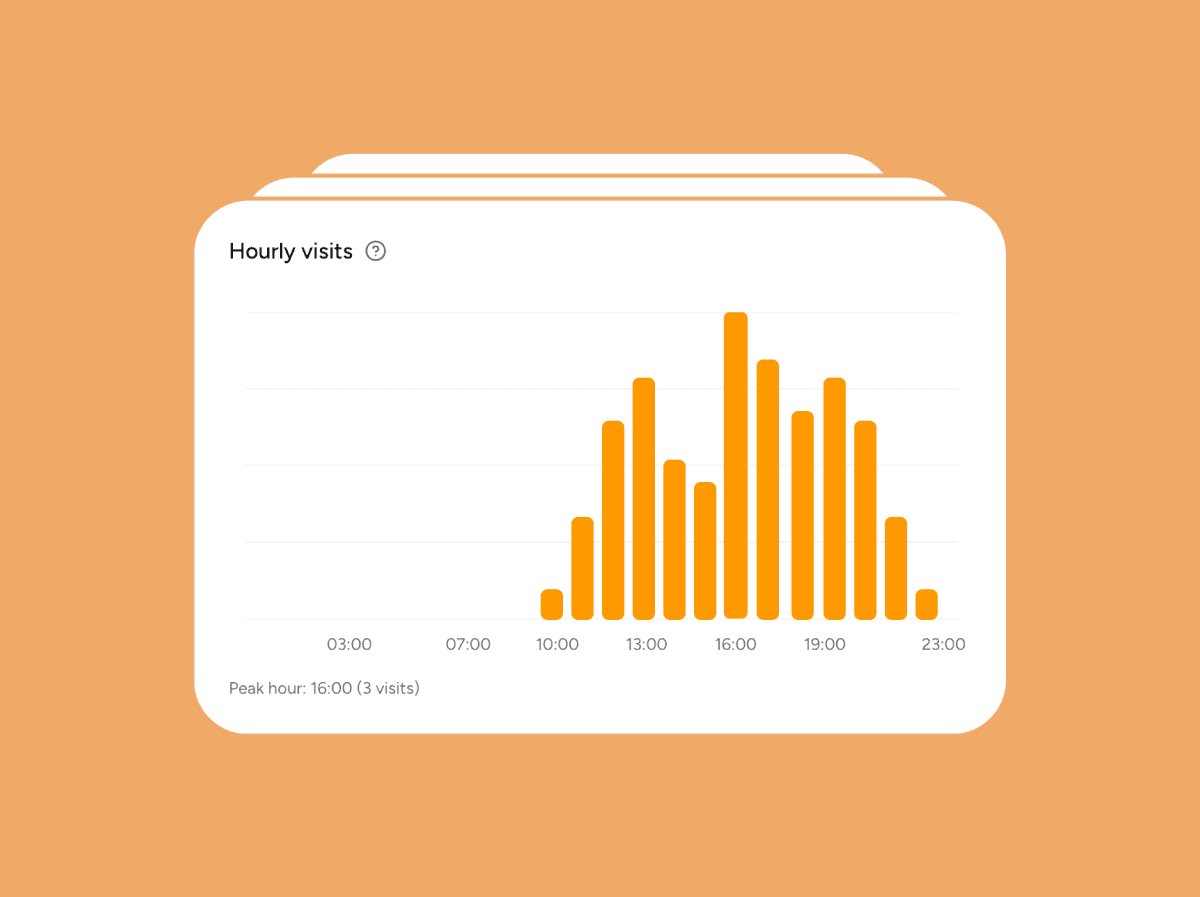
Understand your customer flow with key metrics
Number of customers
How many people waited per hour, day and week.
No-show rate
Unlock patterns on when is your service most pressured.
Average wait times
How long each customer waits and how it it’s evolving over time.
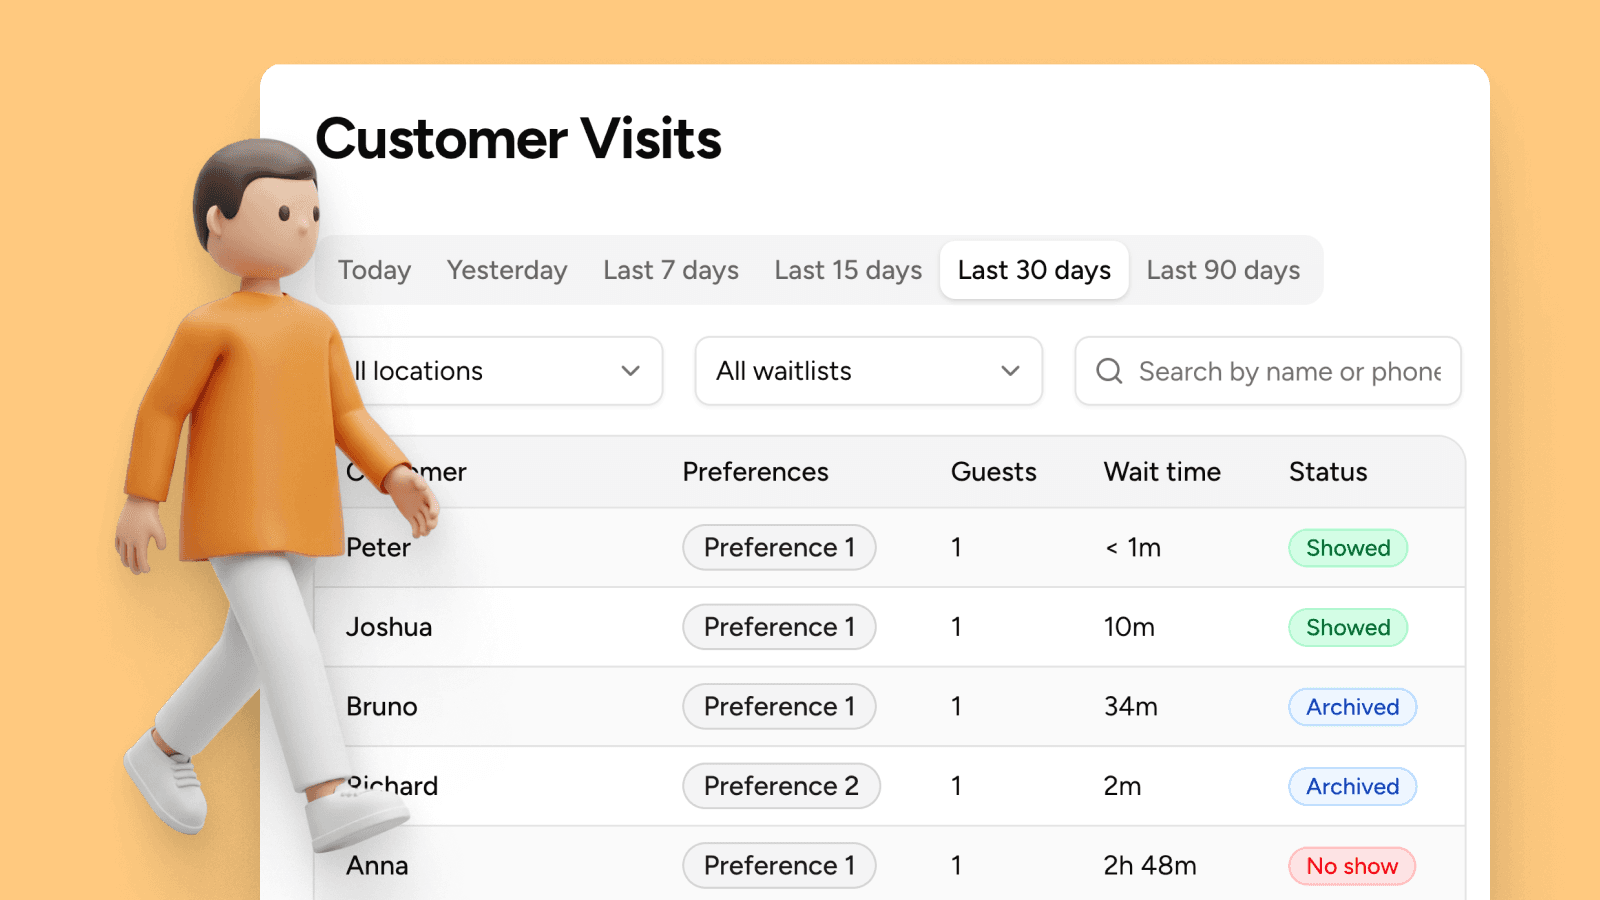
Run the queue with real-time clarity
See who’s waiting, who’s next, and who’s been notified to keep service under control.
- Assess live queue length and wait times
- Move faster with a single view for the team
- Keep the queue fair and consistent, even when the shift gets hectic

Spot trends and fix bottlenecks
Historical reports reveal patterns. Compare weeks, months, or custom ranges and use that data to staff smarter and seat faster.
- Identify long-wait spikes that lead to walk-outs
- Align headcount and roles to real peak patterns, not gut feel
- Measure if changes are working with confidence