


Restaurants lose an estimated $1,500 per week to walk-in guests who leave before being seated. Multiply that across a year and the cost of a poorly managed wait exceeds what most operators spend on marketing. This report compiles the most complete set of publicly available data on restaurant wait times, drawn from academic research, platform-level data, and industry surveys, with a takeaway for operators after each section.
How long do restaurant customers actually wait?
- The average walk-in guest waits 15 to 25 minutes before being seated at a full-service restaurant (Lineup.ai, 2024)
- Toast's Q3 2024 platform data found that waitlist guests who were successfully seated waited an average of 9 minutes
- Guests put on a waitlist stick around for 20 minutes on average before giving up (Toast, Q3 2024)
- The average party size for walk-in restaurant guests is 2 persons, and most are first-time visitors (ScienceDirect, analysis of 94,404 restaurant visits)
- Returning walk-in customers visit approximately every 89 days on average, meaning a bad wait experience has a long tail (ScienceDirect)
Takeaway: The gap between the 9-minute average seated wait and the 20-minute walkaway threshold is narrow. Operators running without accurate wait time estimates are burning through that buffer without knowing it.
How long will customers wait before leaving?
- 72% of diners say they won't wait more than 30 minutes for a table (Toast consumer survey, 2025)
- In 2023, diners said they would wait up to 20 minutes without a reservation. By 2024 that figure had risen to 26 minutes, suggesting slightly improving tolerance (Escoffier, 2025)
- 42% of diners say a wait over 30 minutes would deter them from visiting a restaurant again (TouchBistro 2025 Diner Trends Report)
- Diners aged 45–54 are least likely to wait more than an hour, with fewer than 2% willing to do so. Guests aged 25–35 are the most patient, with 11% willing to wait over an hour (Toast, 2025)
- Peak-time restaurant walkout rates reach 20–30% when waits are not communicated (QueueAway, 2026)
Takeaway: The 30-minute mark is a hard ceiling for most diners. Anything beyond it without active communication will cost covers. The bright spot: tolerance has improved slightly, which suggests guests are more willing to stay when they feel respected and informed. Showing their position in the waitlist at all times through a virtual waiting room mitigates waiting anxiety.
How much revenue do restaurants lose to long wait times?
- Restaurants lose an average of $1,500 per week from customers who leave due to wait times (Toast Restaurant Technology Report, 2025)
- A restaurant losing just 5 walk-in parties per day at a $60 average spend loses an estimated $109,500 per year from walkouts
- During peak hours, walkout rates can reach 25–30% for restaurants without a managed queue, directly reducing the covers seated per service (Qwaiting, 2025)
- Customers who experience wait times beyond the 5-minute threshold at quick-service concepts show a 34% lower return visit rate within 30 days compared to those served under 3 minutes (Agrex.ai analysis of 94,000+ visits)
- A 5-minute reduction in average wait time correlates with a 10% increase in repeat visit likelihood (Toast, 2025)
Takeaway: Walkouts are invisible in a POS system. Nothing is recorded when a guest leaves. That makes the revenue loss easy to ignore, but the compounding effect of lost repeat visits makes the real number much larger than any single-night calculation suggests.
The psychology of waiting: perception vs. reality
- Customers consistently overestimate wait times by 36% when they are not engaged or given any information (FasterLines, 2024)
- A well-communicated 20-minute wait produces higher satisfaction than a poorly communicated 10-minute wait, according to queuing psychology research (University of Northern Utah, Services Management)
- Providing an accurate wait-time estimate reduces perceived wait time by up to 20% without changing actual service speed (FasterLines, 2024)
- Research published in ScienceDirect found that virtual queuing is associated with lower perceived waiting costs than physical queuing, increasing both the intention to wait and the likelihood of ordering more once seated
- Idle time feels disproportionately long: unoccupied waiting feels roughly twice as long as occupied waiting, a principle consistently supported in queuing psychology literature (Services Management, UEN Press)
- 66% of guests say they are more likely to stay and wait if there is a comfortable waiting area (Toast, 2025)
- 58% of male guests are more likely to wait if bar seating is available during the wait (Toast, 2025)
Takeaway: The wait experience is mostly a communication problem, not a capacity problem. Guests who know where they stand and have something to do will wait longer and arrive at the table in a better mood, which affects spend and the likelihood of returning.
Walk-in guest behavior and booking patterns
- 50% of diners either never or rarely make reservations (Toast consumer survey, 2025)
- Only 12% of diners always make a dinner reservation (Toast, 2025)
- 49% of consumers say they want more spontaneous dining experiences, including walk-ins, up from prior years (Upmetrics, 2026)
- 45% of reservations in Q3 2024 were made for the same day, reflecting a broader shift toward last-minute dining decisions (Toast, Q3 2024)
- Casual dining is the most visited restaurant type, with 69% of Americans dining there regularly (Escoffier, 2025), the segment most dependent on walk-in traffic
- 93% of restaurants report having some wait time at their business during peak hours, with an average quoted wait of 30 minutes (Long Range Systems survey of 267 restaurant operators)
Takeaway: Walk-in guests are not a secondary audience. For most casual and full-service restaurants, they represent the majority of covers. The same-day booking trend is pulling reservation guests closer to walk-in behavior, which means the walk-in queue is becoming the front line for nearly every restaurant type.
How transparency and notifications change wait outcomes
- Virtual queues reduce customer complaints about pre-seating wait time by 24.7% without increasing complaints about in-process waits (waiting for food), meaning the benefit carries across the full dining experience (SSRN: "The Psychology of Virtual Queue: When Waiting Feels Less Like Waiting")
- Virtual queues increased overall customer satisfaction ratings by 10.8% compared to no virtual queue, controlling for restaurant location, staffing, and promotional activity, with benefits appearing in the first year of implementation (SSRN, ibid.)
- A 2025 ScienceDirect study found that higher perceived wait equity, when guests feel the wait is fair and worth it, leads to a higher intention to wait and a higher likelihood of ordering more once seated
- Virtual queuing showed the greatest positive impact for restaurants with high substitutability (ie. where several comparable options exist nearby) making it a competitive differentiator in crowded markets (SSRN, ibid.)
- U.S. consumers made 23% more mentions of extended wait times in restaurant reviews compared in 2022, making wait time one of the fastest-growing complaints in hospitality (Yelp data, cited in ScienceDirect 2025)
Takeaway: Transparency is a revenue strategy, not just a hospitality nicety. A guest who knows they're fourth in the queue and receives a text when their table is ready is not standing at the door getting frustrated; they're spending money nearby or sitting at the bar, and they arrive at the table satisfied rather than annoyed.
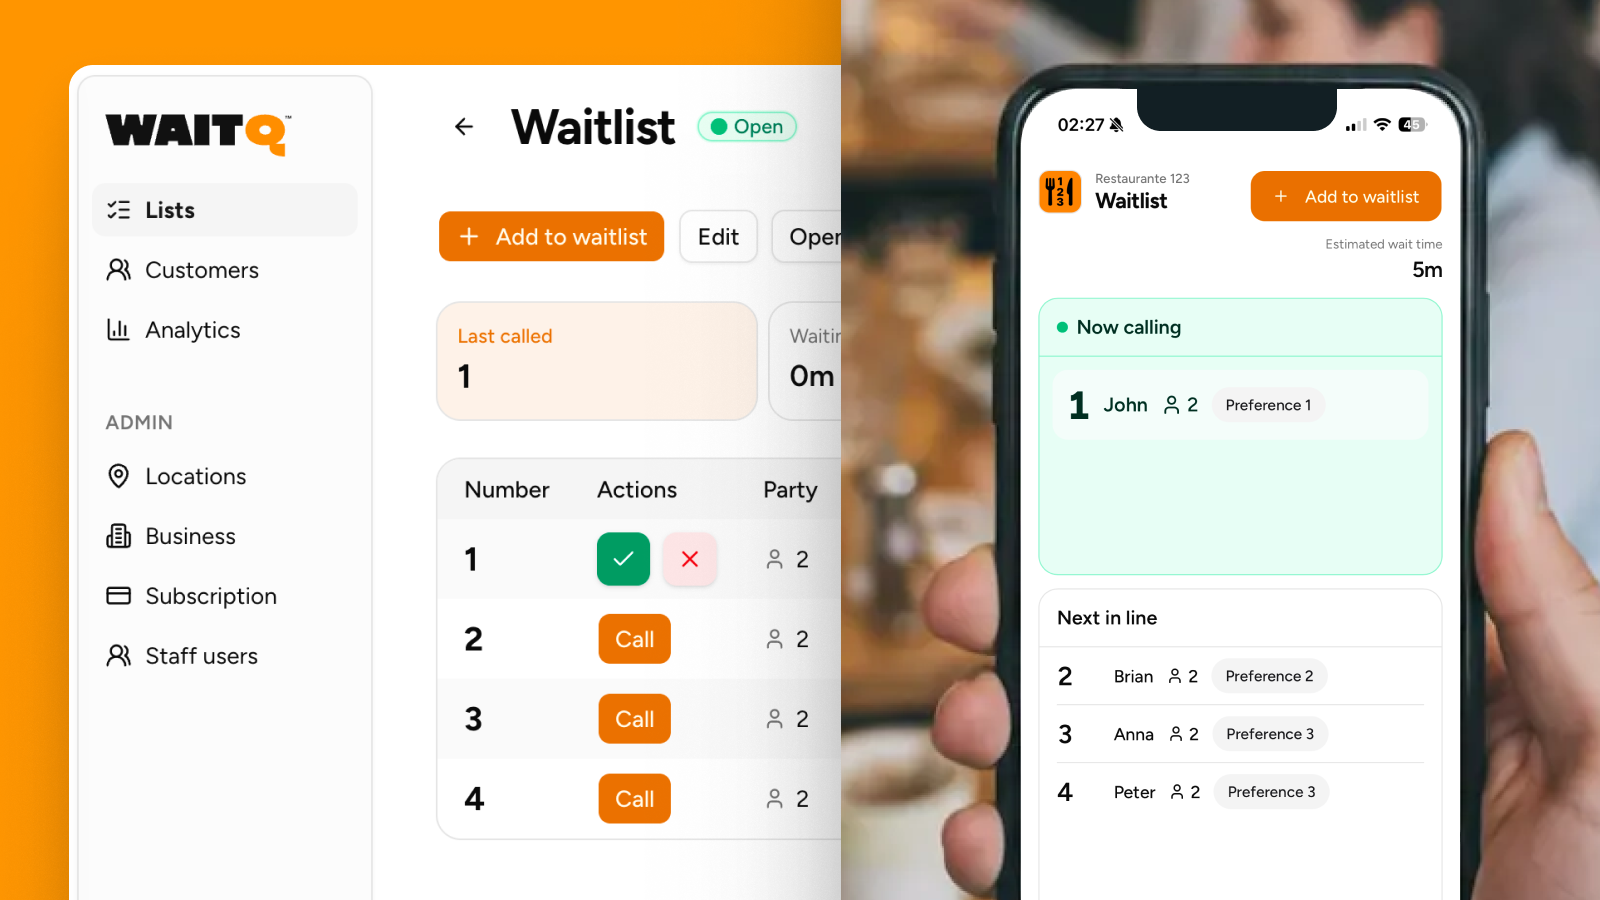
How WaitQ helps restaurants manage the wait
WaitQ is a digital waitlist app built for walk-in-heavy restaurants. Guests join the queue by scanning a QR code, checking in at the door, or using a link. No app download required. Staff then send a one-tap notification via SMS or WhatsApp when the table is ready. A public display screen shows live queue positions so guests can see exactly where they stand without asking.
The result is a smaller gap between arrival and seating, fewer walk-aways, and a front-of-house team that spends less time answering "how long?" and more time turning tables. Analytics track average wait times and peak periods, giving operators the data to staff smarter over time.
You can set up a digital waitlist in under 5 minutes and run a 7-day free trial with no credit card required.
Wrap-up
The data is consistent across every source: most restaurant guests will wait, but only if they feel informed and treated fairly.
The 30-minute ceiling, the 36% overestimation of idle waits, the 24.7% drop in wait complaints when a virtual queue is in place aren't abstract findings. They translate directly into covers seated, revenue recovered, and guests who come back.
The operators who close that gap between arrival and seating, and communicate clearly while guests wait, keep more of the walk-in revenue that most restaurants are quietly losing every shift. For a practical look at how to reduce restaurant walk-aways or improve your waiting experience, both guides are good starting points.