

How much does a haircut cost?
- The US national average haircut price reached $43 in 2026, according to SQUIRE's State of Barbershops report covering 13.9 million appointments across 7,000 shops
- Regional pricing within the US varies: the West averages $45, the Northeast and South average $40, and the Midwest averages $35 (SQUIRE, 2026)
- The average haircut price has risen 97.5% since 2000, when it was $20, still trailing rent and housing inflation over the same period
- In the UK, the average men's haircut runs between £15 and £30, with premium shops in London charging considerably more
- 60% of consumers globally are willing to pay more for a premium barbershop experience, according to verified 2026 data from WifiTalents
- Add-on services push average ticket sizes higher: beard trims, hot towel shaves, and scalp treatments are now offered by around 55% of US barbershops, with full grooming packages running $50 to $100 or more.
- Find specific menu ideas and prices for other services.
Takeaway: Pricing is highly local. A national average is useful context but not a benchmark for individual shops. The more relevant question is what the block around you charges and whether your experience justifies a premium relative to that.
How long will customers wait before leaving?
- 50% of barbershop customers say waiting around is the most frustrating part of their visit, according to a Zenoti survey of over 1,500 beauty and wellness consumers
- The average walk-in wait time at a popular urban barbershop is 45 minutes, according to verified 2026 consumer data
- Research on queue abandonment shows the threshold is lower than most operators assume: abandonment rates nearly double once waits exceed 12 minutes, and at 15 minutes without any progress signal, a significant share of walk-in customers leave
- A 30-minute wait with a visible countdown feels shorter than a 15-minute wait with no information, because the psychology of waiting is about certainty, not duration
- Occupied waiting feels roughly 36% shorter than unoccupied waiting, according to David Maister's queuing psychology research
- Over half of customers are willing to wait longer if they do not have to stand in line, a consistent pattern across Zenoti's consumer research
Takeaway: The walk-away threshold is not fixed, it's a function of information. Customers who know they are third in line and will wait 12 minutes behave completely differently from customers who are told it should not be too long. The first group stays, the second often does not.
Walk-away rates and revenue loss
- At a $43 average ticket, losing just one walk-in per day translates to roughly $13,000 in unrealised annual revenue
- Businesses using digital queue management report an average 25 to 30% reduction in actual wait times and an additional 35% reduction in perceived wait time through transparency features
- One shop tracking Saturday peak demand reported losing approximately 12 customers per Saturday to unmanaged waits, representing more than $24,000 in annual losses from a single peak day
Takeaway: Walk-away customers rarely return: they find another barber, leave no record of their visit, and never tell the shop why they left. They are essentially invisible in any system that does not track them, which makes the revenue loss easy to ignore, but the compounding effect of permanently lost clients makes the real cost much larger than any single-day figure suggests.
Booking patterns and online scheduling
- According to Mangomint, 77.49% of barbershop appointments are now booked online, compared to 22.51% through walk-ins, phone calls, or in-person scheduling
- Despite that shift, 7 in 10 barbershop customers still walk in without an appointment at least sometimes, and 35% say they walk in usually or always
- 76% of clients rank booking convenience equal to service quality, according to SQUIRE's 2026 platform data
- Around two in three bookings on SQUIRE happen through customer self-service, with around 25% of those self-service bookings happening between 6pm and midnight
- Pre-2020, only 15 to 20% of barbershops used management software; today, 72 to 77% of shops use it, and over 90% of new shops launch digital-first
- Shops that adopted barbershop management software saw an average 34% revenue lift after adoption
- 35% of barbershop and salon calls go unanswered each month, representing missed booking and inquiry opportunities
Takeaway: Online booking dominates scheduled appointments, but walk-ins are not a declining minority; in fact, they're still the majority of total visitors at many shops. Modern, growing businesses today manage both client traffic through dedicated software.
Cancellation and no-show rates
- 14.05% of barbershop bookings end in cancellation, the lowest cancellation rate in the hair and beauty sector (for comparison, lash and brow bars exceed 21%)
- Pen-and-paper shops face no-show rates as high as 20%; automated reminders and deposits reduce that number by 89%
- Combined, cancellations and no-shows account for up to 8% of booked appointments at well-managed shops, and considerably more at shops running without reminders
- Shops using automated reminder and deposit tools protected an average of $4,300 or more per month in revenue in 2025
- Text appointment reminders achieve a 98% open rate, making them considerably more effective than email for time-sensitive appointment communication
Takeaway: Barbershops already have the best cancellation rate in personal care. The bigger opportunity is not cutting no-shows further at well-run shops. It is recovering the walk-ins that never make it into the booking system at all.
When are barbershops are busiest?
- Saturday is the highest revenue-generating day for 90% of barbershops globally, according to verified 2026 consumer data
- End-of-week slots generate nearly 40% of all barbershop appointments
- The peak weekday booking hour has shifted: 92% of weekday cuts now happen between 8am and 5pm, with the after-work rush flattening as remote work normalised midday visits
- Weekend demand is significantly higher than weekday volume; Saturday alone is the top revenue day for 90% of barbershops globally, which means weekend queues regularly run at multiples of weekday traffic
- Pre-holiday periods and school holidays create secondary demand spikes that can rival weekend traffic, particularly at shops near schools and transit hubs
Takeaway: Saturdays are typically the strongest day for barbershops which means peak demand is predictable. Shops with no system to communicate wait times during those peaks lose the most revenue precisely when the most customers are trying to come in.
Customer visit frequency and retention
- The average time between visits is 48.5 days, based on SQUIRE's 2026 platform data across 9.79 million appointments, roughly every 7 weeks for customers who return at all
- The average client gets approximately 7 haircuts per year, which is lower than the "every 2 to 4 weeks" figure often cited in industry content
- 65% of men report staying with the same barber for over 3 years, indicating strong loyalty once it is established
- 44.63% of all visits on SQUIRE come from a client who previously visited the same shop; around 48% of clients are one-and-done
- Acquiring a new client costs up to five times more than retaining an existing one, while the probability of selling to a returning client is 60 to 70% versus 5 to 20% for a new prospect
- Barbershops with loyalty programmes report 25% more repeat business than those without
Takeaway: Seven haircuts a year is the actual average. That makes every visit more valuable, and every walk-away more costly. The shops growing fastest in 2026 are winning the rebook, not chasing new clients.
What customers value on their barbershop visit?
- 80% cite quality of work as the primary reason for loyalty (WifiTalents, 2026)
- 76% rank booking convenience equal to service quality (SQUIRE, 2026)
- 60% say excellent results define a great experience; 56% say a quick, easy check-in matters as much
- 50% name waiting around as their biggest frustration
- 45% are influenced by online reviews when choosing a shop (WifiTalents, 2026)
- 86% say they would switch shops after just one bad experience (WifiTalents, 2026)
- 24% feel frustrated by the check-in process before their visit has even begun (Zenoti)
Takeaway: Technical skill gets customers through the door the first time. Check-in and queue experience determines whether they come back. One in four customers already has a negative experience before a single pair of scissors has been touched, and 86% say one bad experience is enough to send them elsewhere.
Market size and regional breakdown
The global barbershop market is valued at $20.1 billion in 2025, with the Americas accounting for $7.4 billion, Asia and Oceania $7.3 billion, Europe $4.4 billion, and Africa and the Middle East $1.0 billion. When informal barbering and adjacent grooming services are included, broader estimates put the global barbershop industry at $40 to $86 billion in 2025.
Regional breakdown and market differences
Market size, growth rate, and barbershop culture vary considerably by region. The table below compares key figures across markets where WaitQ operates.
| Region / market | Market size (2025) | Growth trend | Avg. haircut price | Walk-in culture | Notes |
| United States | $5.8bn | 2.7% YoY | $43 avg. | Strong | ~143,000 shops; national avg. hit $43 in 2026 |
| Europe | $4.4bn | ~3 to 4% | Varies by country | Mixed | Strong in Southern Europe; appointment-driven in the north |
| United Kingdom | Included in Europe | 50% shop count growth since 2018 | £15 to £30 | Very strong | 18,000+ shops; 750 new openings per year |
| Australia | A$559.6m (franchise) | ~6% (2018 to 2023) | A$30 to A$55 | Strong | Mature franchise model; Sydney and Melbourne lead |
| Latin America | $8.64bn hair care | 6.3% | Varies widely | Very strong | Barbershop-specific data limited; Brazil dominates the region |
A few patterns worth noting:
- The US has the largest absolute market but the slowest growth rate. For individual shop owners, the opportunity is not in industry expansion, it is in capturing a larger share of existing local demand.
- The UK is an outlier on shop count growth: 50% more barbershops in six years means street-level competition is intensifying faster than almost anywhere else.
- Australia's franchise sector contracted 6.1% in 2024 after strong prior growth, which likely reflects post-pandemic normalisation rather than structural decline. The walk-in model remains dominant across independent shops.
- In France and Germany, professional at-home haircuts represent roughly 20% of total services, compared to 1 to 2% in the US, reflecting a more fragmented delivery model in parts of Europe.
- Brazil is the fourth largest hair care market globally and the fastest-growing in LATAM, with the mobile barbershop segment projected to grow at 9.4% CAGR through 2034. Barbershop-specific figures are limited, but visit frequency and barber-client loyalty are consistently high across the region.
Takeaway: The operational challenges are consistent across all these markets: walk-away rates, wait time visibility, peak-day demand surges. What differs is competitive pressure. In the UK and dense Australian cities, managing walk-ins well is a survival issue. In Brazil and other fast-growing LATAM markets, it is an early adoption advantage that compounds over time.
How does WaitQ work for barbershops?
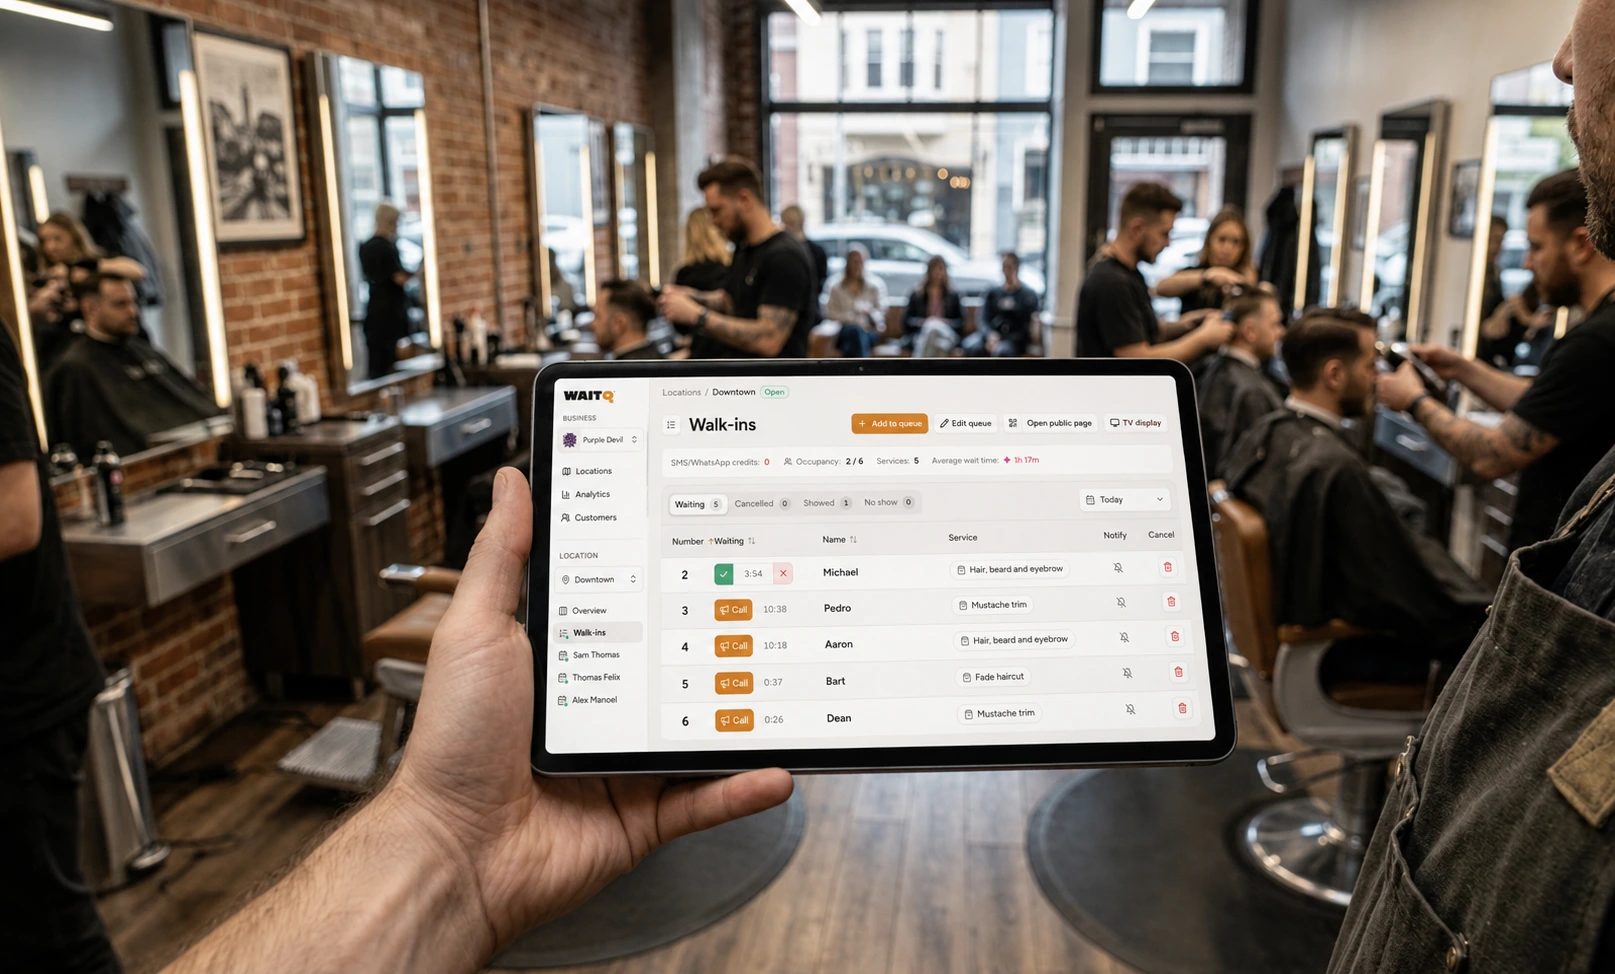
WaitQ is a barbershop waitlist management app that handles walk-ins and appointments from a single dashboard. Customers scan a QR code at the door or visit a public check-in page to join the queue, and receive an SMS or WhatsApp notification when their barber is ready. No app downloads required.
For multi-chair shops, each barber can be set up as a separate counter. It works for regulars who always go to the same person. Your team sees the full queue, each client's requested service, and their wait time, all in real time.
A 7-day trial is available with no credit card required.
Wrap-up
The data points in the same direction across every source: **customers will wait, but only if they feel informed. **The 15 minute threshold, the 36% shorter perceived wait when communication is in place, the 60 to 80% walk-away recovery rate when queue position is visible. These figures translate directly into chairs filled, revenue recovered, and clients who return.
For operators thinking about improving their walk-in management, the starting point is visibility: show customers where they are, tell them when to come back, and let them wait somewhere comfortable. The revenue difference between shops that do this and shops that do not is significant.
